1.2 DetectionsList objects

While Detections objects represent individual receivers, an array of receivers is stored as a list of detections objects: a DetectionsList.

detlst <- DetectionsList(det_1, det_2, det_3, det_4, det_5, det_6)
plot(detlst, main = "M\u00f6rrums\u00e5n array")
mtext("CRS: WGS 84, UTM zone 33N", adj = 0)

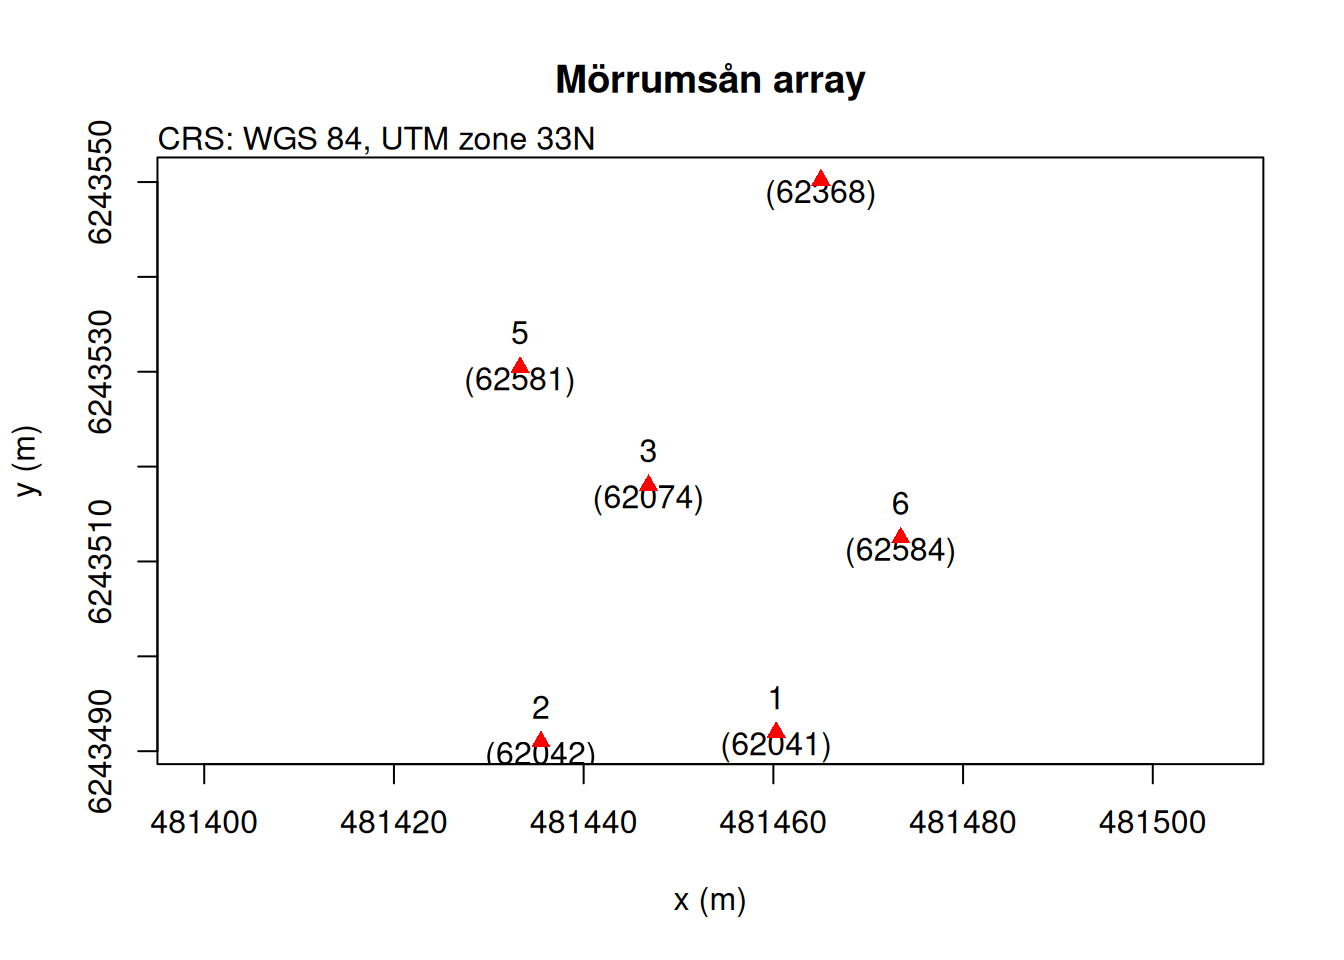
DetectionsList objects give handy summary tables when evaluated. Below we can see the number of sync-tag emissions/detections within the array in addition to the detections of a tagged smolt swimming by (tag id: HR-53883 & PPM-53883).

detlst
## DetectionsList
## 
## Receiver Summary
##                    1     2     3     4     5     6    
## Sync-tag ID        62041 62042 62074 62368 62581 62584
## Sync-tag emissions 144   144   144   144   142   144  
## Tag detections     651   827   677   611   765   425  
## Tags detected      7     7     7     7     7     6    
## 
## Detections Summary
##     Tag-ID     First detection      Last detection   n Detection period (h)
##   HR-53883 2021-05-08 20:41:34 2021-05-08 21:29:30 708                 0.80
##      62074 2021-05-08 18:00:09 2021-05-09 05:59:56 587                12.00
##      62368 2021-05-08 18:02:21 2021-05-09 05:55:31 564                11.89
##      62584 2021-05-08 18:00:48 2021-05-09 05:52:23 548                11.86
##      62041 2021-05-08 18:01:03 2021-05-09 05:58:01 514                11.95
##      62042 2021-05-08 18:00:38 2021-05-09 05:56:37 498                11.93
##      62581 2021-05-08 18:00:42 2021-05-09 05:55:42 465                11.92
##  PPM-53883 2021-05-08 20:55:51 2021-05-08 21:22:06  72                 0.44

You can also easily convert lists of Detections objects into DetectionsList objects.

list_of_detections <- list(det_1, det_2, det_3, det_4, det_5, det_6)
detlst <- as.DetectionsList(list_of_detections)