Making figure panel labels in base R
R’s grid package has a pretty comprehensive system for specifying coordinate systems when drawing objects.
This is particularly well suited for making figure panel annotations in a consistent manner.
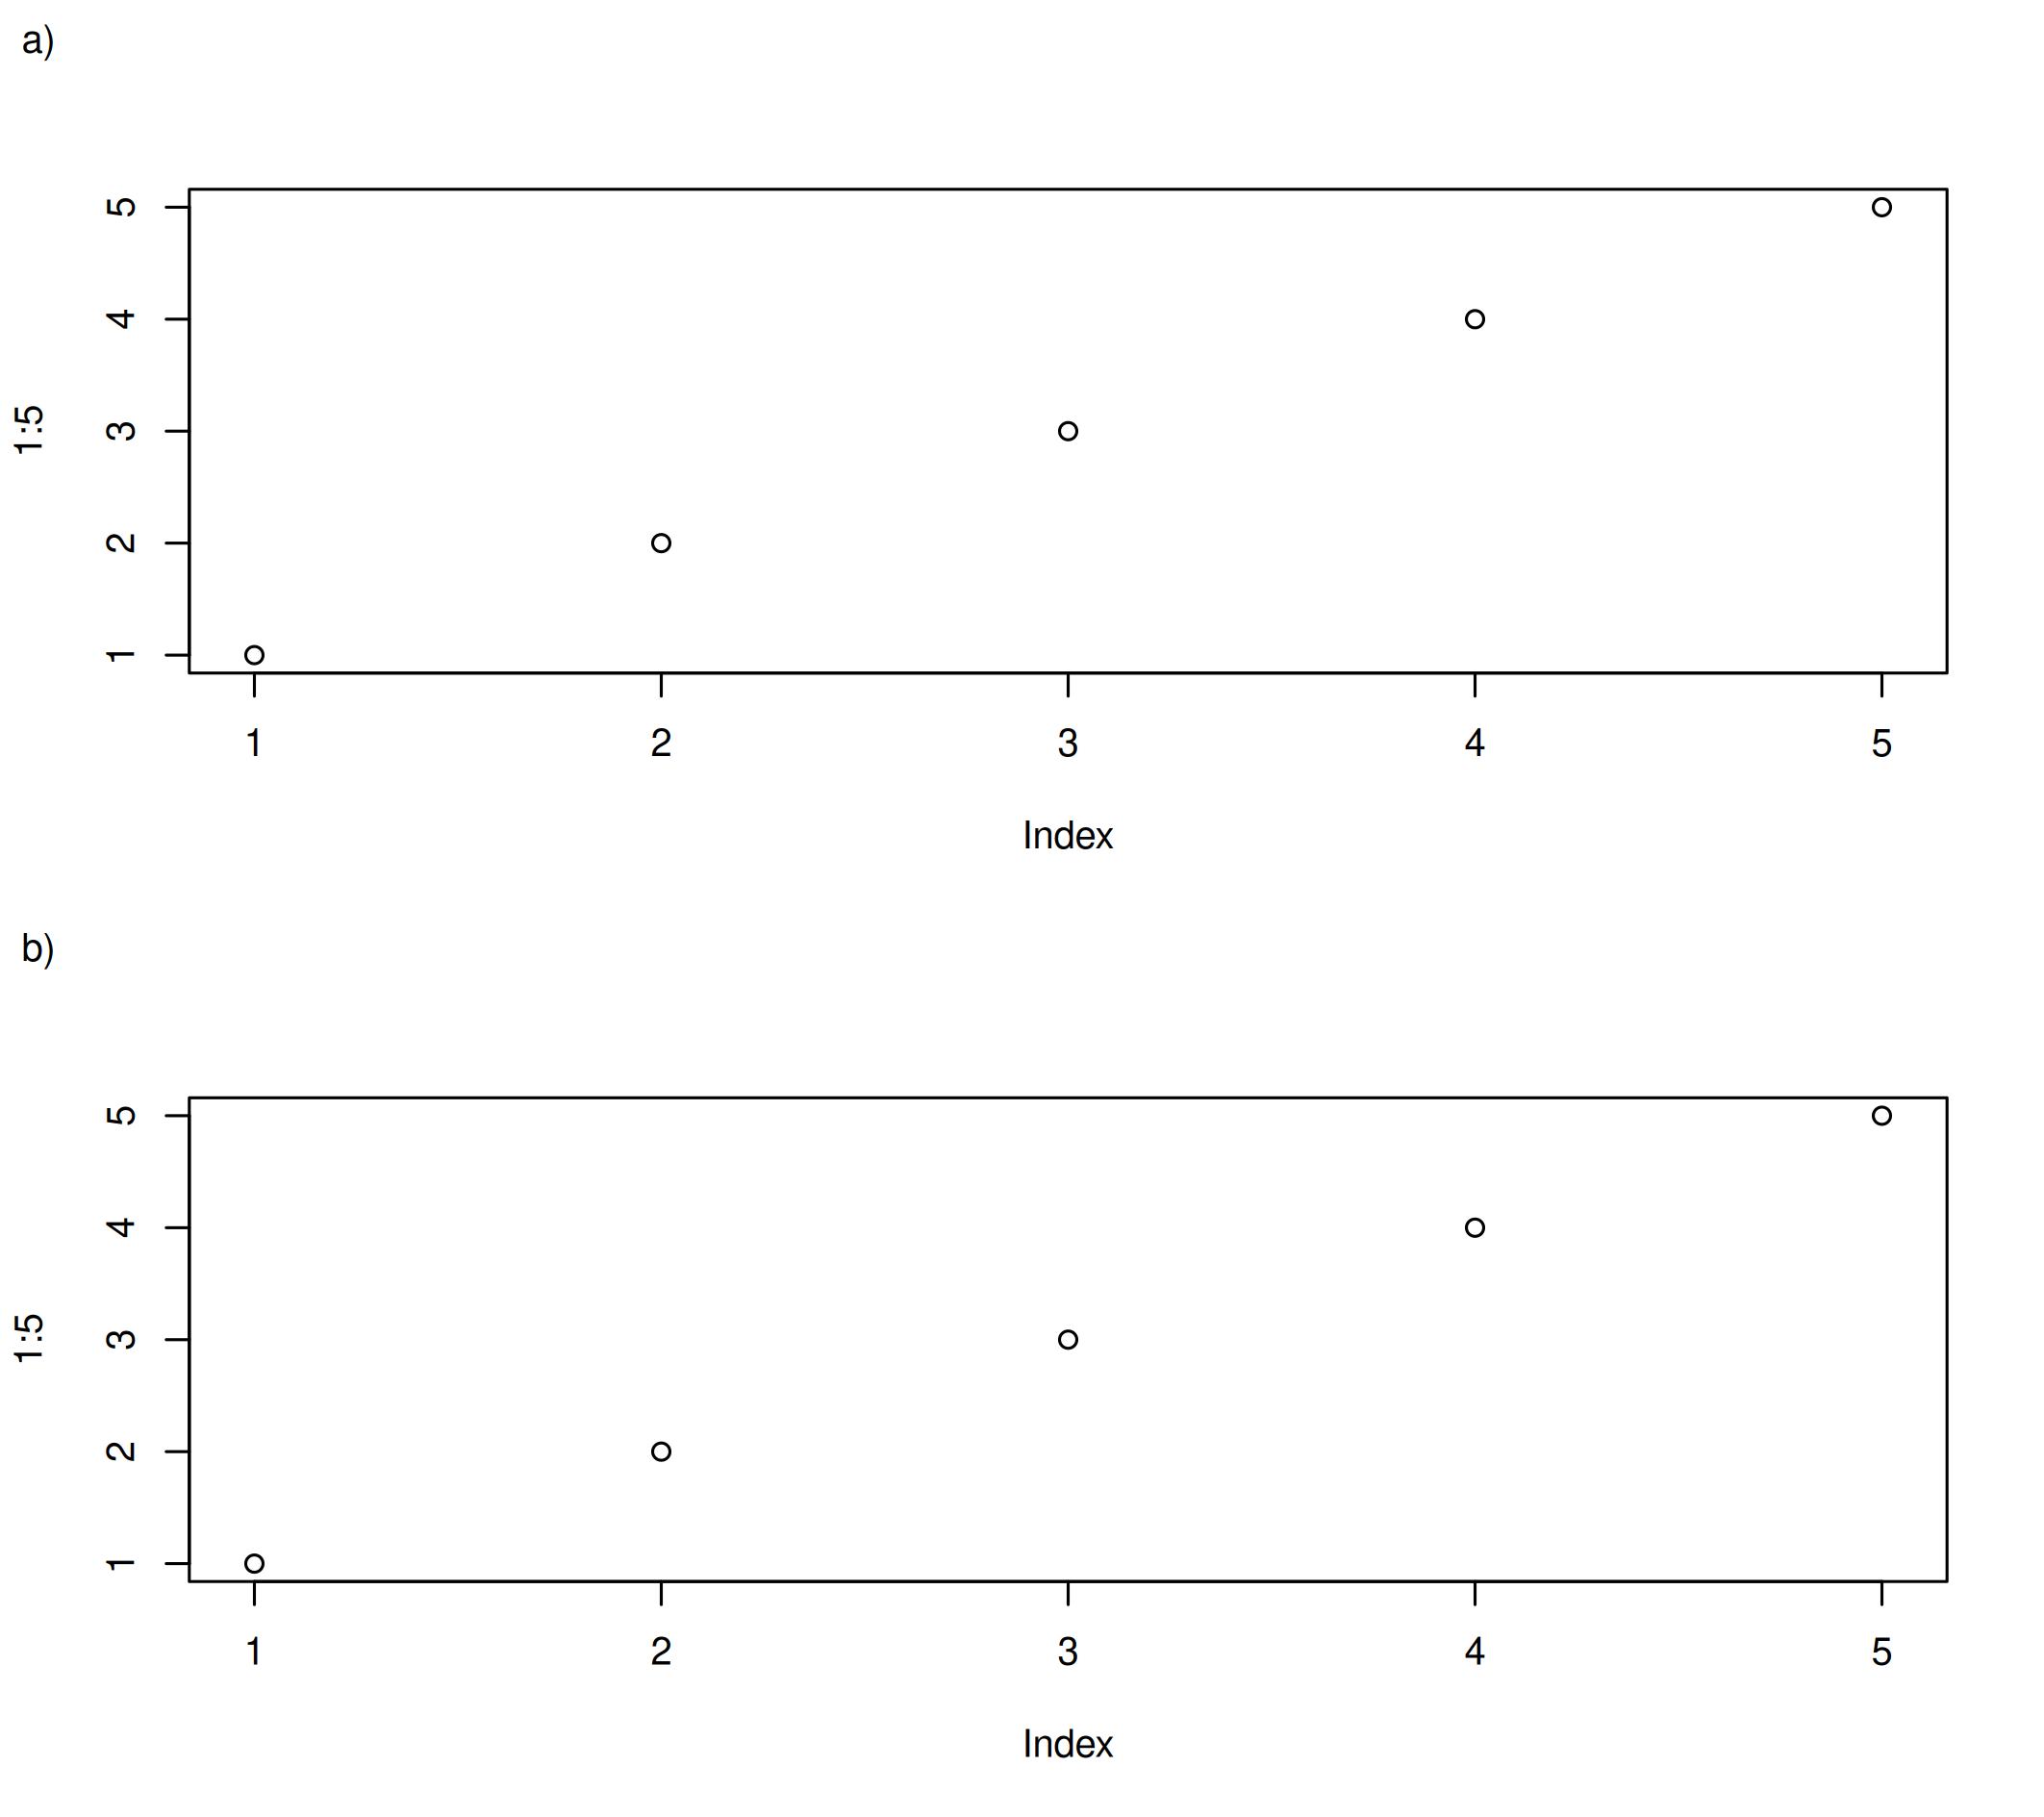
For example, lets say we have a figure which has two panels (top and bottom). We can specify that we want to draw an annotation label in the upper left corner of the each panel.
annot_x <- grid::unit(0,        units = "npc")
annot_y <- grid::unit(c(1,0.5), units = "npc")
Here, "npc" gives the coordinate system where (0,0) is the lower left corner of the graphics device, and (1,1) is the upper right corner.
Next, we can specify that we want the annotation to be offset by 1 character; shifted slightly down and the right to make sure the printed character lies within the graphics device. Note that we can combine coordinates with different units.
annot_x <- annot_x + grid::unit(1,  units = "char")
annot_y <- annot_y + grid::unit(-1, units = "char")
Finally, we can draw our labels.
grid::grid.text(
  label = c("a)", "b)"),
  x = annot_x, y = annot_y,
  gp = grid::gpar(cex = par("cex")))
The option gp can be used to set a font scaling parameter. Here, we’ve reused the scaling parameter stored in par("cex") (the parameter used for scaling base::plot functions.
Below we can put it all together in an example script.
# Open new graphics device
png("test_1.png", width = 18, height = 16, units = "cm", res = 300)

# Draw 2 panel plot
layout(matrix(c(1,2), nrow = 2))
par(cex = 0.8)# Font/shape scaling
#par(xpd = NA) Required when using par(mfrow) to create panels
plot(1:5)
plot(1:5)

# --- Add panel labels
# Get label positions
annot_labels <- c("a)", "b)")
annot_x <- grid::unit(c(0),     "npc") + grid::unit( 1, units = "char")
annot_y <- grid::unit(c(1,0.5), "npc") + grid::unit(-1, units = "char")
# Draw labels
grid::grid.text(
  label = annot_labels,
  x = annot_x, y = annot_y,
  gp = grid::gpar(cex = par("cex")))# Inherit scaling constant from par()

# Close graphics device
dev.off()
When using par() to create figure panels, by default xpd = FALSE will cause drawing to be clipped to the current panel region. Hence, panel annotations will have to be drawn one panel at a time at the same time as your plots.
To draw the annotations across all panels with a single command after all your plots have been made, you can set par(xpd = NA).