Making a colorbar in base R graphics
The below snippet provides a function that can be used to plot colorbars in base R.
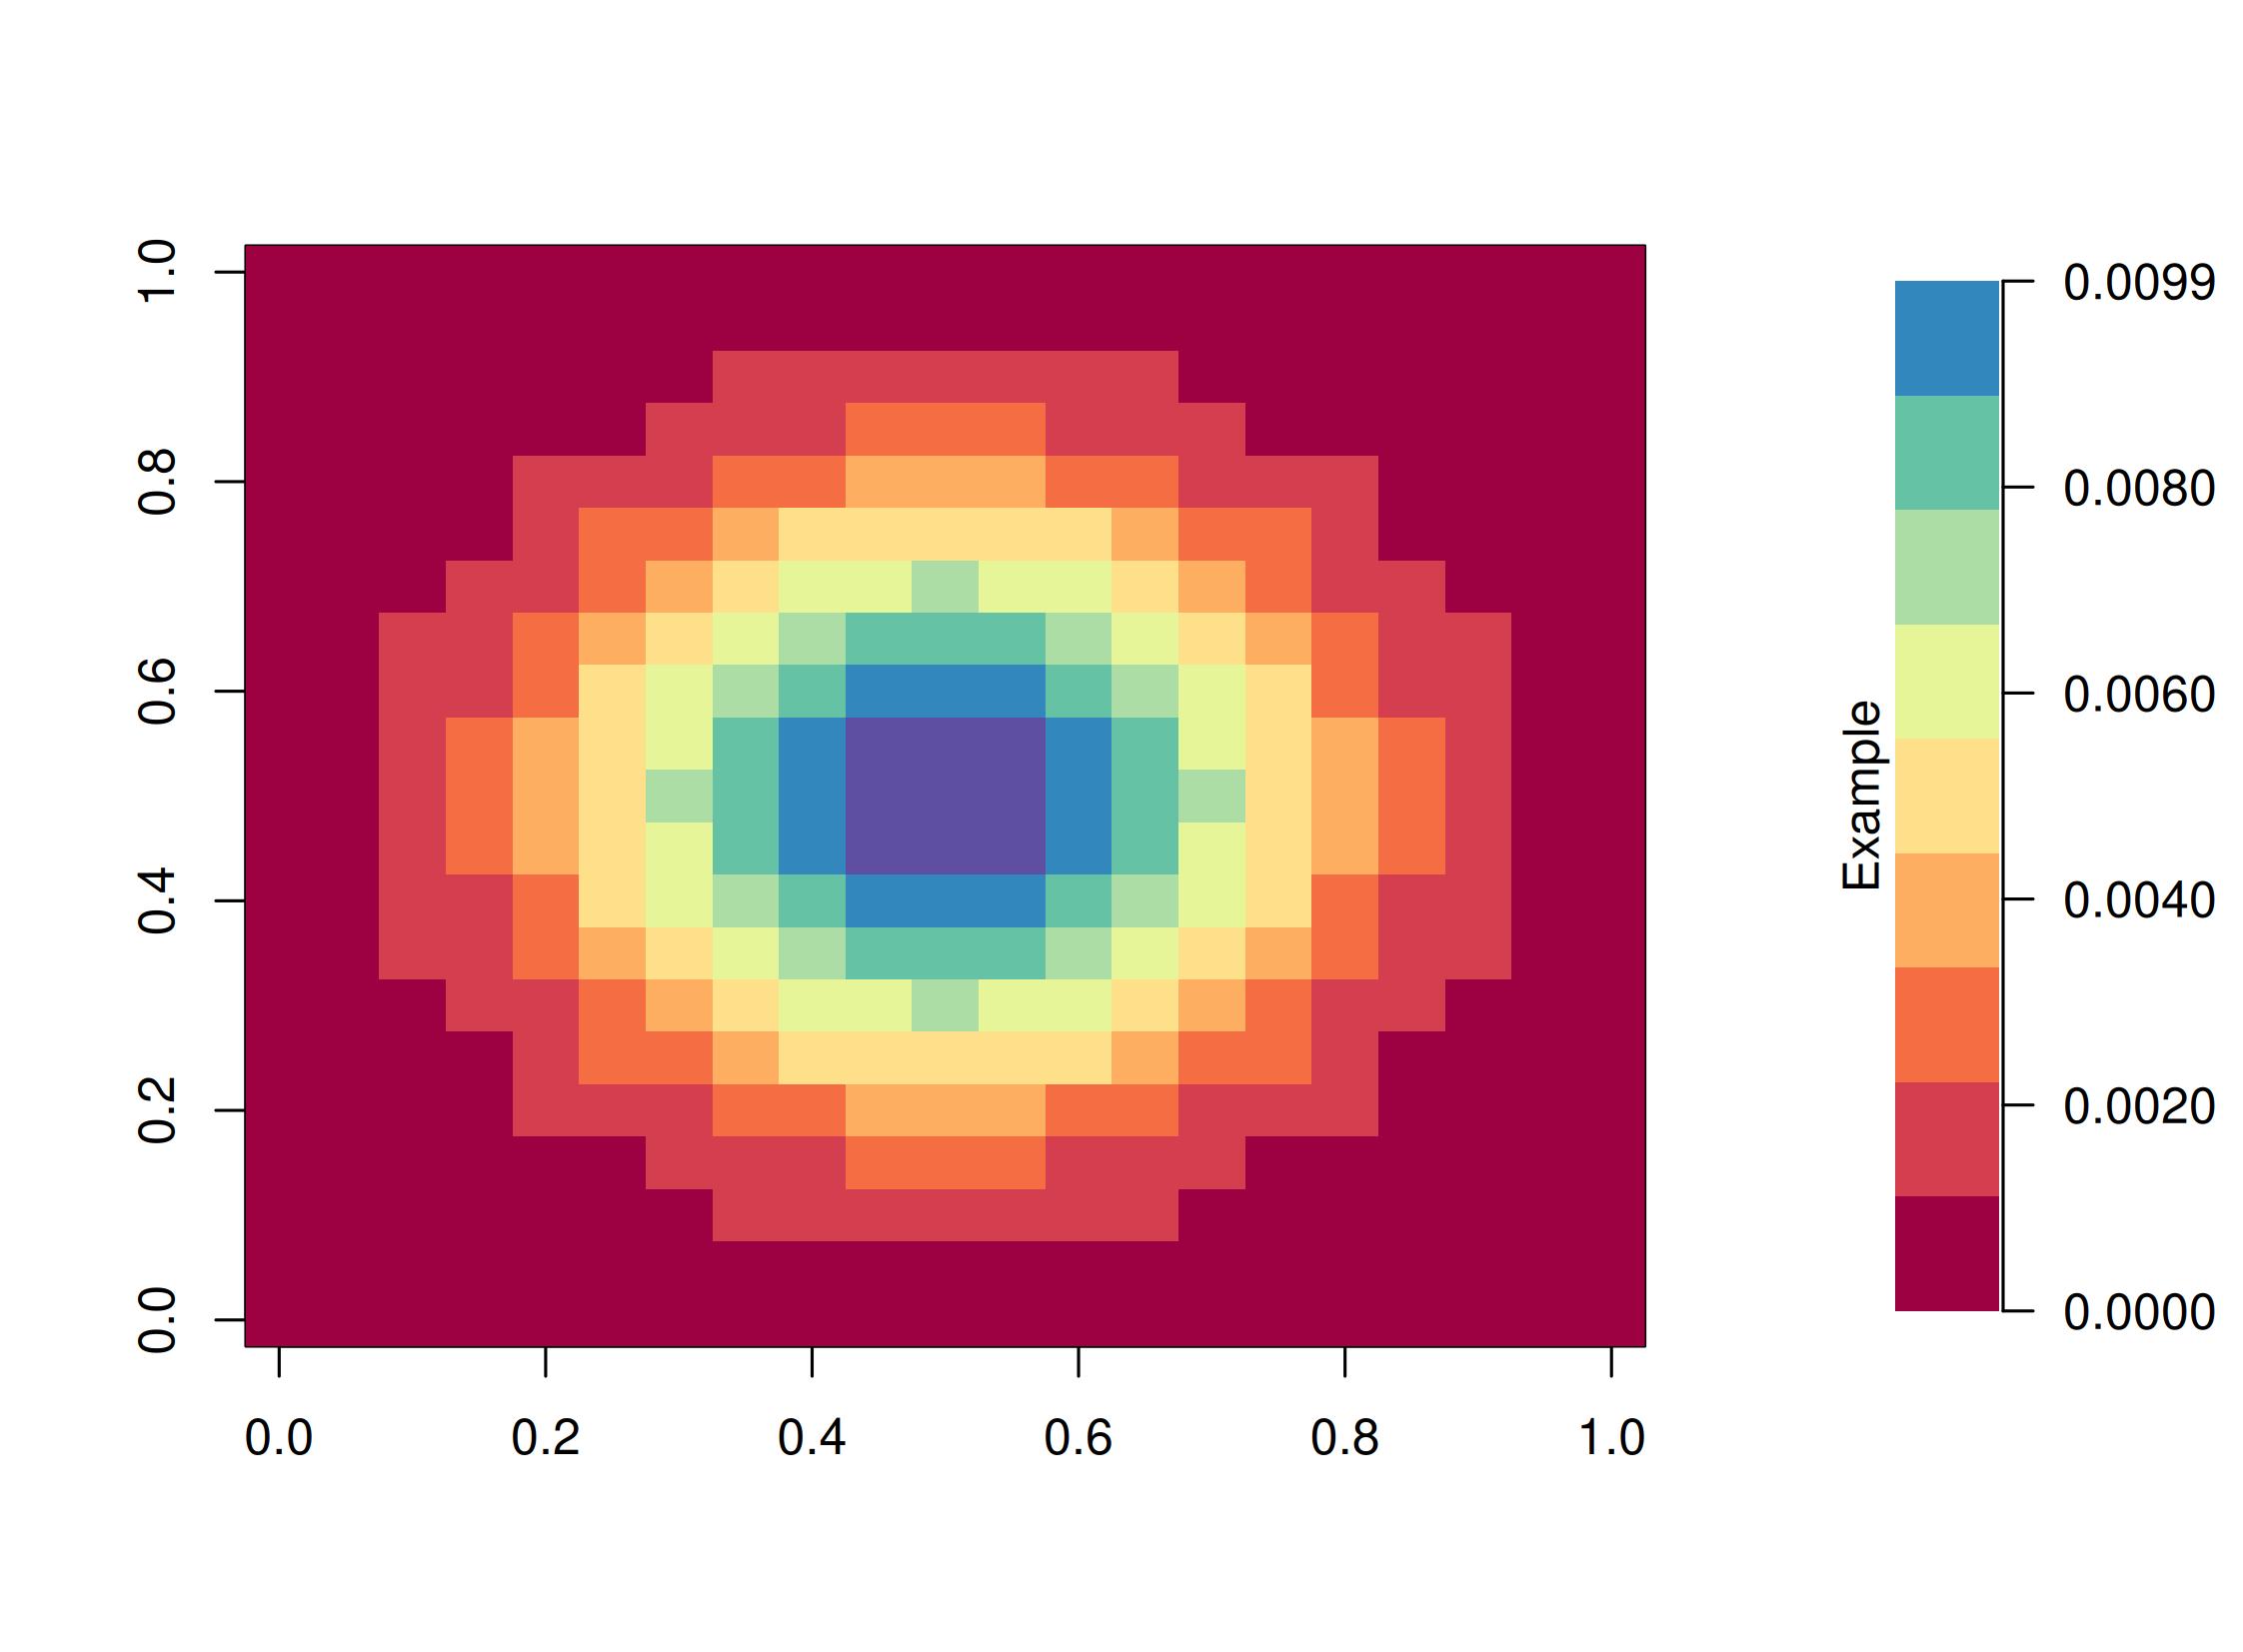
This can be pretty useful when paired with graphics::image().
Below is an example script along with the output image.
# Load colorbar function
source("https://gitlab.com/-/snippets/5935072/raw/main/colorbar.R")

# Create a 2D Gaussian raster to plot
mat <- matrix(1, nrow = 21,ncol = 21)
gaus <- dnorm(-10:10, mean = 0, sd = 4)
mat <- apply(mat, MAR = 1, FUN = `*`, gaus)
mat <- apply(mat, MAR = 1, FUN = `*`, gaus)

# Init output device
jpeg("test.jpeg")
layout(matrix(1,2, nrow = 1), widths = c(1, lcm(4)))

# Plot raster
pal <- RColorBrewer::brewer.pal("Spectral")
image(mat, col = pal)
# Plot colorbar
colorbar(pal = pal, min = min(mat), max = max(mat),
  nticks = 6, title = "Example", prec = 4)

# close graphics device
dev.off()
In the above example, note that I used layout to align the colorbar beside the plot.
This is pretty important as it accepts fixed widths for the colorbar panel via layout::lcm.
The image plot on the left will then take up the remaining space not used by the colorbar.